Amazon Performance Metrics Reporting Automation
Amazon sellers and ecommerce teams spend a huge amount of time gathering performance data manually. One person opens Seller Central to check account health, another exports order defect information, someone else reviews return trends, and then the team tries to combine everything into a report that is already partially outdated by the time it reaches the final spreadsheet. For smaller operations, this is annoying. For larger teams managing multiple stores, brands, or client accounts, it becomes a constant reporting burden.
The problem is not only that manual reporting takes time. It also creates inconsistency. Different team members may pull data at different times, use slightly different filters, miss a metric, or structure reports in different ways. One weekly report may emphasize delivery defects while another focuses on return rate or late shipment trends. As the business grows, this makes it harder to see performance clearly and act on the right problems quickly.
That is exactly why more sellers, agencies, and operators want Amazon performance metrics reporting automation. Instead of manually logging into every store, exporting the same reports, copying figures into spreadsheets, and chasing updates, automation can centralize the reporting workflow and turn it into a repeatable operational system. With the right setup, your team can collect metrics more consistently, generate reports faster, and spend more time interpreting performance instead of assembling it.
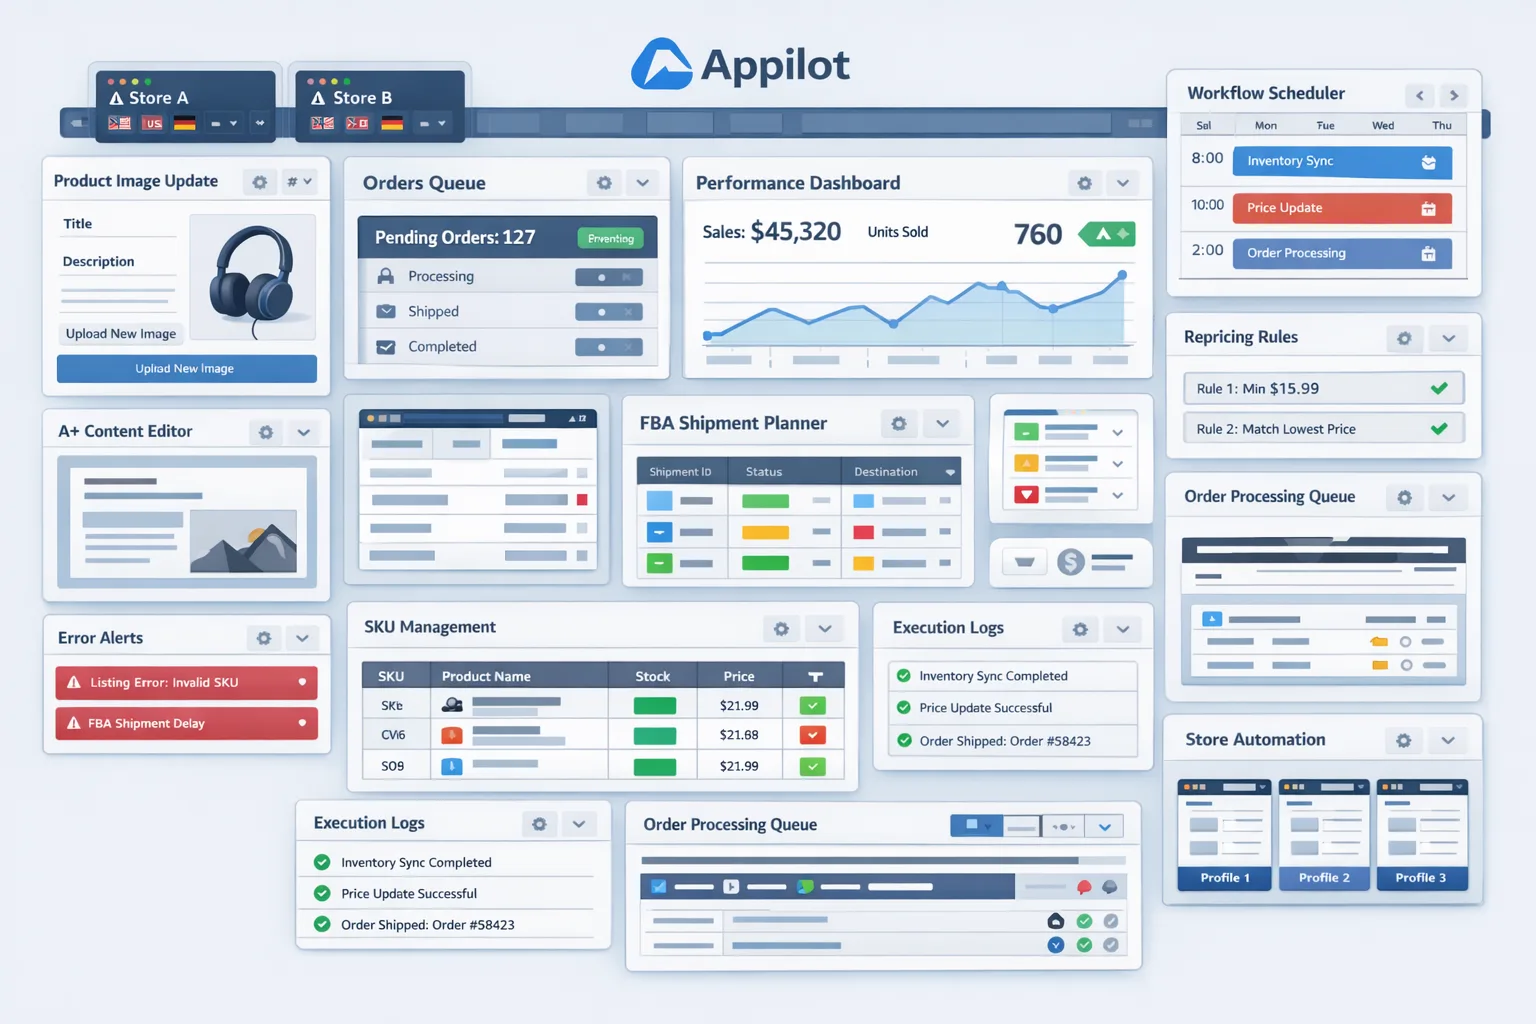
For this guide, I will use Appilot as the workflow automation layer because it fits this kind of repeated browser-based reporting task naturally. This is not about pushing a product into a blog where it does not belong. It belongs here because the challenge is operational repetition across browser-based seller environments, and that is where a workflow layer becomes useful. The broader principles remain the same regardless of stack: reduce repetitive manual work, improve reporting consistency, and create a cleaner path from raw store metrics to actionable insight.
In this guide, you will learn why performance metrics reporting automation matters, what you need before building it, how to structure the workflow step by step, which safeguards matter most, and what kind of outcomes you can realistically expect when the process is running correctly.
Why Amazon Performance Metrics Reporting Automation Matters in 2025
Performance visibility is one of the most important parts of running a healthy Amazon operation. Account health, order defect rate, cancellation metrics, return patterns, late shipment issues, customer experience signals, and operational trends all affect how well a store runs. These numbers are not just for compliance or reporting. They directly influence store stability, growth decisions, and where your team should focus attention.
The difficulty is that reporting often becomes fragmented as operations grow. A single seller may be able to check their metrics manually without much pain. But a business managing several brands, marketplaces, or client accounts quickly runs into a different reality. Each store has its own dashboard, its own reporting rhythm, and its own set of metrics that need regular monitoring. Pulling those figures manually becomes repetitive very fast.
If a team spends even twenty to thirty minutes per store every few days collecting and organizing performance numbers, the monthly labor cost adds up quickly. That time is usually spent on low-value repetition rather than analysis. People are clicking, exporting, copying, cleaning, and formatting, when they should be identifying trends, spotting risks, and deciding what to improve.
Automation matters because it shifts the reporting process from manual assembly to structured collection. Instead of visiting each seller environment by hand and rebuilding the same reporting sequence every time, the workflow can launch the correct profile, navigate the right dashboards, gather the required figures, record them consistently, and surface exceptions where necessary. The team still reviews the output and acts on it, but the routine reporting burden becomes far lighter.
The Manual Approach vs. the Automated Approach
The manual approach to Amazon performance reporting usually depends on browser bookmarks, spreadsheets, and memory. Someone logs into store one, checks the relevant metric pages, exports data or copies values, pastes them into a spreadsheet, and then moves to store two. The same process repeats until the report is finished. On paper, it sounds manageable. In practice, it becomes tedious and error-prone as soon as more stores are added.
The automated approach changes the structure completely. Instead of rebuilding the report by hand each time, you define a reporting workflow once and let the system handle the repeated browser tasks. The workflow can move through stores in sequence, pull the required metrics from defined pages, write them into a structured output, and flag unusual values or missing information for review. The human role becomes review, validation, and interpretation rather than repetitive collection.
This shift matters because performance reporting is not where your team should be spending most of its energy. The real value lies in what happens after the report exists. Which metrics are worsening, which stores are improving, which operational problem needs attention first, and what decisions should be made next. Manual reporting delays that work. Automated reporting accelerates it.
For agencies, aggregators, and larger sellers, this also creates consistency. Every report can follow the same structure, the same metric logic, and the same collection order. That makes trends easier to compare across time and across stores.
What You Need to Get Started
To automate Amazon performance metrics reporting, you need a clear reporting framework first. Decide which metrics matter most to your operation. This may include account health measures, shipping-related indicators, return trends, cancellation rates, customer service signals, or any other recurring performance data your team reviews regularly. Automation works best when the reporting target is already defined.
You also need structured browser profiles for each store or seller environment. If your team manages multiple stores, those environments should not be handled through loose tab switching and inconsistent sessions. Clean profile separation makes the workflow more stable and the reporting process easier to scale.
The third requirement is a workflow system that can execute repeated browser tasks reliably. This is where Appilot becomes useful in a natural, non-forced way. It provides a practical layer for coordinating repeated browser actions across multiple store environments, which is exactly what metrics reporting requires. Instead of building an overly custom process from scratch, operational teams can structure the workflow around the reporting routine they already understand.
Finally, you need a reporting destination. This can be a spreadsheet, dashboard, database, or internal reporting table. The important thing is that the output structure is consistent. If the workflow gathers data but writes it into an unclear or messy destination, the time savings will be smaller and the reporting value will drop.
Step-by-Step: Setting Up Amazon Performance Metrics Reporting Automation
The first step is deciding what your report should contain. This sounds simple, but it matters more than most people realize. Do not automate every possible metric just because it exists. Start with the set of numbers your team actually reviews regularly. These are the ones that create the clearest business value when gathered consistently. A focused reporting workflow is easier to test, easier to trust, and easier to expand later.
The second step is organizing your store environments properly. Each Amazon store should have its own dedicated browser profile or session environment. This prevents account confusion and makes the reporting sequence predictable. If multiple people manage the same operation, profile organization becomes even more important because reporting workflows depend on clean, repeatable store access.
The third step is connecting those profiles to your workflow system. In this example, Appilot is the automation layer managing the browser-based reporting routine. That makes sense for a use-case like this because the challenge is repeated operational navigation across seller dashboards rather than a one-time export task.
Now define the workflow logic clearly. A standard reporting sequence might launch store profile one, open the relevant performance dashboard, capture the required metrics, write them to the reporting destination, mark the store as completed, and then move to store two. The same logic repeats until the reporting cycle is finished. Some businesses may also want a second layer that flags values outside the acceptable range so the report highlights issues instead of just listing numbers.
A good workflow also includes validation. If the required page does not load, if a metric field is missing, or if a value looks obviously incomplete, the system should not quietly continue as if everything is normal. It should log the issue and flag that store session for human review. Reporting automation is only useful when the output can be trusted.
Start with a small test run. Use one or two stores first and compare the automated report to a manual reference report. Do the values match. Did the workflow navigate correctly. Was the output written into the right columns or fields. Were any metrics skipped because the page layout behaved differently than expected. These early checks are essential because reporting errors are often subtle. A broken order-processing workflow is usually obvious. A broken reporting workflow can look fine while quietly collecting the wrong values.
After the first successful run, refine the timing and page checks. Add pauses where needed, especially on dashboards that load more slowly. Use element confirmation rather than hard-coded assumptions whenever possible. The reporting routine should feel steady and controlled, not rushed and brittle.
Once the test phase is stable, expand gradually. Add more stores, broaden the reporting set, and consider grouping reports by region, brand, or client. Larger operators may also want scheduled execution so the workflow runs at consistent intervals and produces a uniform reporting rhythm without relying on manual reminders.
A strong implementation usually follows this pattern. First, the team defines the exact metrics to monitor. Second, store profiles are structured clearly. Third, the reporting workflow launches those profiles one by one. Fourth, the system navigates to the relevant dashboards and gathers the required data. Fifth, the output is written into a central destination. Sixth, missing data or unusual figures are flagged for review.
That process is where the real value appears. Your team stops spending hours rebuilding the same report manually and starts spending more time understanding the performance picture the report reveals.
Safety and Best Practices for Amazon Performance Metrics Reporting Automation
The first rule is to keep the reporting scope focused at the beginning. Do not try to automate every dashboard and every metric at once. Start with the set your team truly depends on and expand after the foundation is stable.
The second rule is to separate store environments clearly. Multi-store reporting becomes unreliable when account sessions are mixed casually. Clean profile management reduces that risk and makes the workflow more dependable.
The third rule is to validate output regularly. Even after the workflow is live, spot-check automated reports against manual references from time to time. Reporting accuracy matters more than reporting speed. If the numbers are wrong, the whole process loses value.
The fourth rule is to build logging and exception handling into the workflow from the start. You should always know which store profiles were processed, which metrics were gathered successfully, and where the workflow encountered incomplete or suspicious output. Good automation is transparent.
The fifth rule is to scale gradually. Reporting workflows often look easier than they really are because the work is repetitive and visually simple. But small page differences, slow-loading dashboards, or missing metrics can create quiet reporting errors. Gradual rollout helps catch those issues early.
Real Results: What to Expect
In the first week, expect more setup and testing than dramatic time savings. You will be defining metric scope, organizing store profiles, validating output, and making sure the reporting destination is structured correctly. This stage is about trust.
By the second and third weeks, the operational improvement becomes easier to feel. Reports that once took substantial manual effort start appearing with much less repetitive work. The team spends less time collecting data and more time reviewing trends and identifying action points.
By the second month, the strongest benefit is usually consistency. Reporting happens in the same format, the same order, and with less dependence on who happened to run it manually that day. For agencies and multi-store sellers, that consistency is often more valuable than the raw time savings alone.
The realistic result is not a completely hands-free reporting system that never needs checking. The realistic result is a much more efficient and reliable reporting process that reduces routine labor and improves decision-making visibility.
Common Problems and Solutions
One common problem is collecting too many metrics too early. Teams often start with a broad reporting ambition and then discover that half the fields are rarely used. The fix is to narrow the scope to a useful core report first and only expand once the process is stable.
Another issue is inconsistent page behavior across stores. Some dashboards or account views may vary slightly depending on permissions or account condition. The solution is to segment stores by similarity and test each workflow version against the environments it will actually handle.
A third issue is weak output structure. If the reporting destination is unclear or overloaded, automated data becomes difficult to interpret. The solution is to design the output format carefully before scaling the workflow.
The last major issue is trusting the report too quickly without verification. Early-stage reporting automation should always be cross-checked against manual data until confidence is earned through repeated successful runs.
Choosing the Right Tools for Amazon Performance Metrics Reporting Automation
The right tools depend on the complexity of your reporting needs. Small operations may only need lightweight automation around one or two core dashboards. Larger businesses managing several stores or client accounts need profile control, reporting consistency, central logging, and a workflow layer that can move through multiple seller environments predictably.
For this use case, a profile-based browser structure paired with a workflow automation layer is usually the strongest practical setup. Appilot fits well here because it supports repeated browser-based operational tasks across profiles without forcing the team into a heavy custom engineering project. That makes it a natural fit for reporting workflows where the value lies in repeated consistency rather than technical novelty.
This is also a strong place for related internal resources in your final publishing version. Browser integration guides, multi-store Amazon workflow posts, and broader ecommerce operations content all fit naturally because the reader is already thinking in terms of process efficiency and scale.
Scaling Beyond Basic Reports
At a small scale, teams can still review every store output closely. At a larger scale, reporting becomes a systems problem. The challenge is no longer gathering one store’s metrics correctly. It is gathering many stores’ metrics consistently while keeping the output easy to review and compare.
That is where structure matters most. You need grouped reporting logic, better exception visibility, and a workflow that helps operators supervise the reporting cycle instead of manually constructing it every time. As scale grows, visibility becomes more important than raw speed. The point is not just to gather data faster. It is to see performance more clearly across the full operation.
The teams that do this well usually combine good process discipline with practical automation. They define their metric priorities clearly, structure store access carefully, and treat automation as a support system for decision-making rather than a shortcut around operational thinking.
Frequently Asked Questions
Q1: Can Amazon performance metrics reporting really be automated?
Yes, the repeated browser-based collection layer can be automated in a practical way. The safest approach is to automate routine metric gathering and keep validation and interpretation with human operators.
Q2: What should I automate first?
Start with the report your team already uses most often. Do not begin with a massive all-in-one reporting project. A smaller core report is easier to test and trust.
Q3: Why is Appilot relevant here?
Because this is a repeated browser workflow problem across multiple store environments. Appilot fits naturally as the workflow layer coordinating those repeated reporting actions.
Q4: Do I still need manual review?
Yes. Automation should reduce repetitive collection work, not eliminate oversight. Spot-checking and trend interpretation remain important.
Q5: How much time can this save?
That depends on store count and reporting frequency, but teams managing several stores usually save meaningful hours each month once repetitive report assembly stops being manual.
Q6: What is the biggest mistake teams make?
Automating too broad a reporting set too early. The best results come from starting with the core metrics that genuinely drive decisions and expanding only after the workflow is stable.
Conclusion
Amazon performance metrics reporting automation is valuable because it turns a repetitive reporting burden into a structured operational workflow. Instead of manually collecting the same numbers from the same dashboards across multiple stores, your team can define the report once, automate the browser-based collection layer, and shift its effort toward analysis and action.
The biggest benefit is not just time savings, although that matters. It is consistency. Reports become easier to compare, easier to trust, and easier to use for decisions when they are gathered through a clean and repeatable process. That is especially important for multi-store operations where manual reporting becomes fragmented very quickly.
The best way to implement this is to start with a focused reporting scope, organize store profiles clearly, use a workflow layer like Appilot where it naturally helps, and validate output carefully before scaling. When done properly, reporting automation does not just reduce manual effort. It improves operational visibility across the business.