Automation Memory Leak Crashing Your Computer? Fix This

The Workflow Starts Fine But Eventually Everything Slows Down
One of the most frustrating problems in automation is when the workflow starts normally but becomes slower and slower over time until the computer eventually crashes. At first everything looks fine. Browser profiles launch, scripts run, tasks complete, and the system feels stable.
Then after a few hours, everything starts getting worse.
The browser becomes slow. The computer starts freezing. RAM usage keeps climbing. CPU usage stays high. Tabs stop responding. Eventually the automation crashes completely.
That is usually a sign of a memory leak.
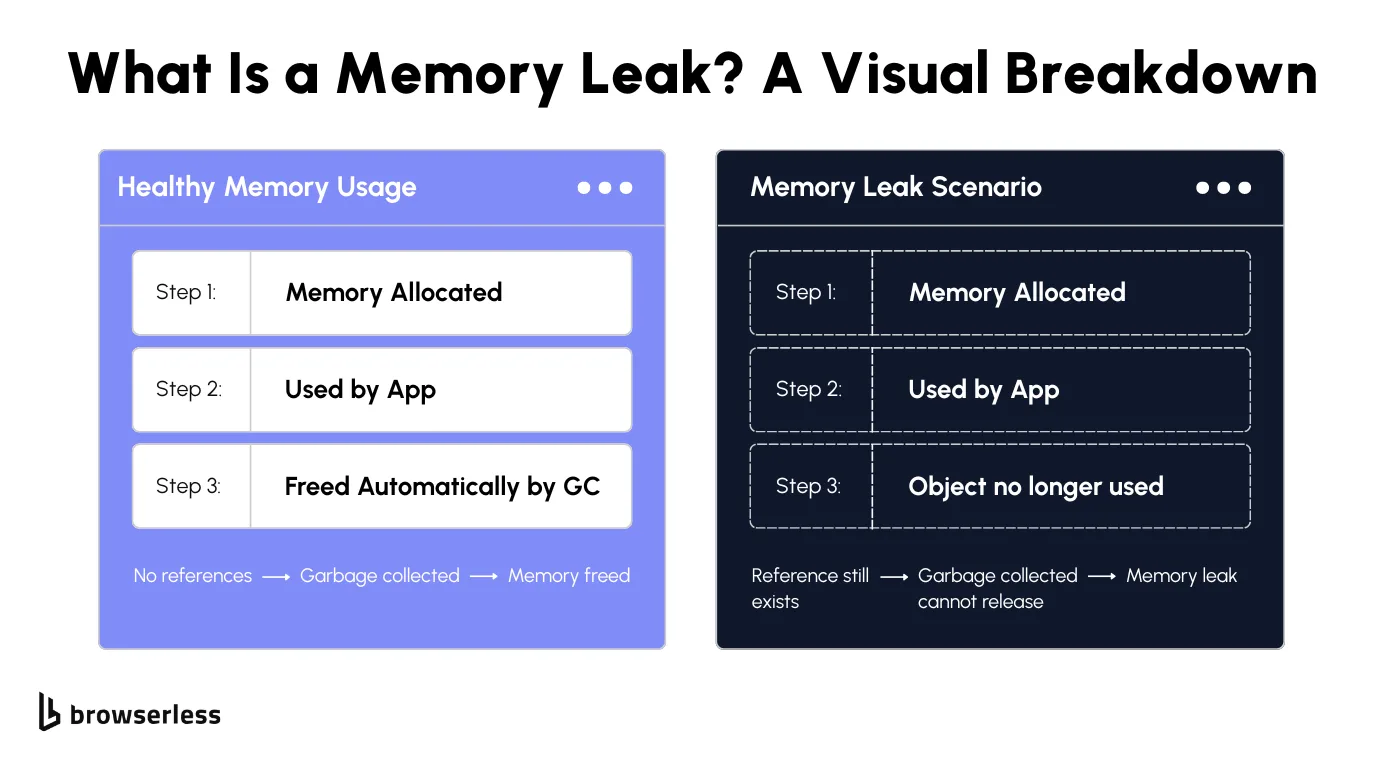
Memory leaks happen when the automation keeps using more RAM without properly releasing it. The longer the workflow runs, the worse the problem becomes.
This is especially common in browser automation because modern browsers use a lot of memory even before automation starts. Once you add multiple tabs, browser profiles, proxies, extensions, scripts, screenshots, logs, and Android emulators, RAM usage can increase very quickly.
Why Browser Automation Uses So Much Memory
Most browser automation workflows use more memory than people expect because every browser profile acts like its own separate environment. Each profile may have its own cookies, cache, tabs, extensions, local storage, fingerprinting settings, proxy connections, and browser session.
That means running twenty profiles is not the same as running one browser twenty times.
It is closer to running twenty separate browsers at once.
This becomes even heavier if the profiles stay open for long periods, keep loading new pages, or accumulate large amounts of browser data. Some websites are also much heavier than others. Social media platforms, e-commerce dashboards, video sites, and large SaaS tools often use huge amounts of memory on their own.
The Biggest Mistake: Leaving Everything Running Forever
One of the biggest reasons memory leaks become severe is because people leave browser profiles, tabs, sessions, logs, and scripts running for too long.
A browser that runs for ten minutes may be fine.
A browser that runs for twelve hours without restarting may become very unstable.
Over time, tabs continue using memory, cached data keeps growing, screenshots build up, logs become larger, and some browser processes fail to release RAM correctly.
That is why long-running workflows often become much slower than short workflows.
The easiest way to reduce memory leaks is by restarting browser profiles regularly, clearing old tabs, closing unused sessions, and restarting the browser after large batches of tasks.
Why Extensions And Heavy Profiles Make The Problem Worse
Many people forget that browser extensions use memory too. Ad blockers, password managers, automation extensions, proxy extensions, note-taking tools, translation tools, and fingerprinting tools all consume RAM.
That may not seem like a big problem with one profile, but it becomes much heavier when running dozens of profiles at once.
A browser profile with ten extensions, years of cookies, large storage files, multiple tabs, and saved sessions will usually use much more RAM than a clean profile.
That is why lightweight browser profiles are usually more stable for large-scale automation.
If you only need one extension for the workflow, remove the rest. If a profile has years of old cache and storage, clean it regularly. If a task only needs one tab, close everything else.
Why Weak Hardware Creates More Crashes
Sometimes the automation itself is not the main problem. The real issue is that the computer does not have enough resources for the workload.
Running a few browser profiles may work fine on a normal laptop. Running fifty browser profiles, Android emulators, scraping tools, and automation scripts at the same time requires much more RAM and CPU power.
This becomes especially common when people try to scale too quickly.
A machine with 8 GB of RAM may struggle badly once multiple browsers, profiles, proxies, and scripts are active. Even 16 GB can become tight for larger operations.
That is why hardware matters. Faster CPUs, more RAM, SSD storage, and stronger cooling can make a huge difference for long-running automation.
Why Centralization Makes This Easier
Memory leaks become much harder to diagnose when browser profiles, Android devices, schedules, logs, performance reports, and proxy settings are spread across different systems. You may have one platform for browser automation, another for monitoring, another for logs, and another for proxies. That makes it difficult to understand which workflows are using the most memory.
This is one of the reasons Appilot becomes useful when automation starts scaling. Instead of keeping browser profiles, Android workflows, schedules, task history, proxy notes, logs, and performance tracking spread across multiple systems, everything can stay visible from one dashboard. That makes it easier to monitor RAM usage, identify heavy workflows, spot unstable browser profiles, and keep large-scale automation more stable.
Conclusion: Memory Leaks Usually Come From Long-Running, Heavy Workflows
If your automation keeps using more RAM until the computer crashes, the issue is usually not one single bug. The problem is that browser profiles, tabs, extensions, logs, cache, and scripts keep building up over time without being cleaned up properly.
Once you restart profiles regularly, reduce unnecessary extensions, clean heavy browser data, and use stronger hardware, it becomes much easier to keep automation stable for longer periods without slowing everything down or crashing the machine.