How to Extract Data from Tables and Export to CSV Automatically
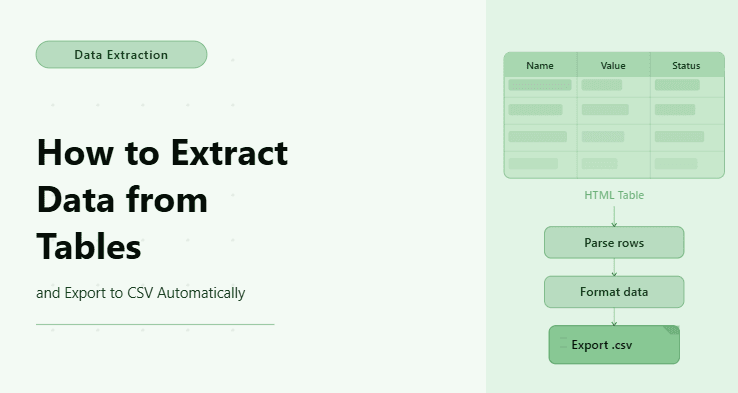
By the end of this tutorial, you will have a simple automation workflow that can open a web page, read data from a table, clean it into a structured format, and export it into a CSV file automatically. This is useful when you regularly copy rows from dashboards, reports, admin panels, pricing pages, order tables, analytics screens, or internal tools and want to stop doing that work manually.
To follow along, you need Python 3.9 or higher, basic comfort running scripts from the terminal, and a general understanding of how HTML tables work. We will keep the code light and focus more on the structure of the workflow, because the goal is not to build a huge scraper but to understand the repeatable pattern: open the page, locate the table, extract rows, format the data, and save it.
This setup usually takes one to two hours to build and test, depending on how clean the table is and whether the page requires login. If you later need to run this across multiple accounts, scheduled reports, or different browser profiles, Appilot can help as the execution layer while keeping the extraction logic itself mostly the same.
You will build a workflow that turns web table data into a CSV file automatically so it can be opened in Excel, Google Sheets, reporting tools, or another automation step.
What This Tutorial Builds — And Why This Approach
This tutorial builds a table extraction workflow that reads visible table data from a web page and saves it into a CSV file without requiring manual copy-paste. The workflow is intentionally simple because most table automation tasks do not need a complex system at first. They need a reliable way to identify the table, loop through the rows, collect the cell values, and store the result in a clean format.
The reason this approach works well is that tables already have a natural structure. Rows become records, columns become fields, and CSV is one of the easiest formats for storing that data. Instead of trying to scrape the whole page, the workflow focuses only on the table area, which makes the automation easier to debug and less likely to break when unrelated parts of the page change.
At a small scale, this can run locally with Python and Playwright. At a larger scale, where table extraction needs to happen daily, across many profiles, or for multiple client dashboards, Appilot becomes useful because it can help schedule and monitor the runs without changing the core extraction logic.
How the System Works — Architecture Overview
The workflow starts by opening the target page in a browser, waiting for the table to load, and selecting the table element. Once the table is available, the script reads the header row to understand the column names, then reads each body row and converts the cells into structured records.
After extraction, the records are written into a CSV file. The final output is a clean spreadsheet-ready file that can be reviewed manually, uploaded into another tool, or used as input for another automated process.
Part 1 — Environment Setup
Step 1 — Install the Required Tools
The first step is to install Playwright, which lets Python open and control a browser so the automation can read tables that are rendered on real web pages. This is especially useful when the table is loaded with JavaScript and does not appear in the initial page source.
pip install playwright

playwright install chromium
After installation, confirm that Playwright is available before continuing.
playwright --versionStep 2 — Create a Simple Project Structure
A small project structure is enough for this workflow because we are keeping the code focused. You only need one main script, one output folder for CSV files, and one logs folder for troubleshooting if something fails.
mkdir table-to-csv-automation && cd table-to-csv-automation

mkdir data logs

touch main.py
This keeps the workflow easy to understand and avoids overengineering the first version.
Part 2 — Finding the Table on the Page
Step 3 — Identify the Table Selector
Before writing extraction logic, you need to identify the table you want to capture. In most cases, you can right-click the table in the browser, inspect the element, and look for a stable selector such as an ID, a data-testid, or a clear class name.
A good selector might look like table, #orders-table, [data-testid="report-table"], or .analytics-table. The best selector is specific enough to target only the table you need, but not so fragile that it changes every time the site updates its design.
Step 4 — Wait for the Table to Load
Many modern dashboards load table data after the page itself has loaded, so the automation should wait until the table is visible before trying to extract anything. If you extract too early, you may get an empty file even though the table appears a second later in the browser.
await page.goto("https://example.com/report")

await page.wait_for_selector("table")
This small wait step prevents many common extraction failures.
Part 3 — Extracting Table Data
Step 5 — Read Headers and Rows
The basic extraction pattern is simple. Read the table headers first, then read each row, then pair each cell with the correct header. This gives you structured data instead of a messy list of text values.
rows = await page.locator("table tr").all_inner_texts()This lightweight version gives you the visible text from each table row. For many simple tables, that is enough to begin processing the data into CSV format.
Step 6 — Clean the Extracted Data
Raw table text often includes extra spaces, line breaks, hidden labels, or formatting differences. Before exporting, clean each value so the CSV is readable and consistent.
cleaned_rows = [row.split("\t") for row in rows if row.strip()]This example assumes the browser returns tab-separated row text, which is common for simple table extraction. If your table uses a more complex layout, you may need to extract individual cells instead, but the overall idea stays the same.
Part 4 — Exporting to CSV
Step 7 — Save the Data as a CSV File
Once the table rows are cleaned, the next step is exporting them into a CSV file. Python’s built-in csv module is enough for this, so you do not need a heavy library for basic exports.
import csv


with open("data/table_export.csv", "w", newline="", encoding="utf-8") as file:

    writer = csv.writer(file)

    writer.writerows(cleaned_rows)
After the script runs, you will have a file named table_export.csv inside the data folder. You can open it in Excel, Google Sheets, or any reporting tool that supports CSV imports.
Step 8 — Validate the Output
After exporting the file, always open it once manually during testing to confirm that the columns line up correctly and that rows are not merged or shifted. A CSV file can technically be created successfully while still being wrong, so validation is an important step.
You should check that the header row appears correctly, each table row appears on its own line, and values with commas or special characters are preserved properly. If the output looks misaligned, the issue is usually in how the row text is being split before writing to CSV.
Part 5 — Handling Real-World Table Problems
Step 9 — Dealing with Pagination
Many tables only show a limited number of rows per page, which means your automation may need to click through pagination before exporting the full dataset. The safest approach is to extract the current page, click the next button, wait for the table to update, and repeat until the next button is disabled.
You do not need to build this on day one unless your table actually uses pagination. Start with one page first, confirm the output is correct, and only then add pagination logic.
Step 10 — Handling Login-Protected Tables
If the table is behind a login, your workflow needs an authentication step before extraction. The simplest version is to open the login page, enter credentials, and then navigate to the table page after authentication succeeds.
For production use, session persistence is usually better because logging in every run can trigger security checks or slow down the workflow. A saved browser session lets the automation behave more like a returning user instead of a fresh login every time.
Step 11 — Scaling with Appilot
At this point, the extraction workflow works locally, but larger operations introduce new challenges. If you need to extract tables from multiple dashboards, profiles, client accounts, or scheduled reports, manually running scripts and checking output files becomes inefficient.
This is where Appilot can help as the execution layer. The table extraction logic can stay simple, while Appilot helps manage when the workflow runs, which profile it runs under, and whether the run succeeded or failed. That makes it useful when table extraction becomes a recurring business process instead of a one-time script.
FAQ
Q1: What is table extraction automation?
Table extraction automation is the process of using a script to read data from a web table and save it into a structured format such as CSV without manual copy-paste.
Q2: Can I export dynamic JavaScript tables to CSV?
Yes, using a browser automation tool like Playwright allows the page to fully render before extracting the table, which works better for JavaScript-loaded dashboards.
Q3: What if the table has multiple pages?
You need to add pagination logic that extracts the current page, clicks next, waits for the table to update, and repeats until no more pages are available.
Q4: Do I need Appilot for this workflow?
No, you can build and run this locally. Appilot becomes useful when you need to run table exports across multiple profiles, schedules, or accounts.
Conclusion
Extracting table data and exporting it to CSV automatically is one of the most practical browser automation workflows because it replaces repetitive manual reporting with a clean, repeatable process. The key is to keep the first version simple: identify the table, wait for it to load, extract the visible rows, clean the values, and write them into a CSV file.
Once the basic workflow works, you can add pagination, login handling, scheduling, and monitoring as needed. Start with a reliable single-table export first, then expand only when the output is accurate and consistent.