Why Your Analytics Don’t Match Platform Native Stats (And How to Fix It)
You Check the Numbers… And They Don’t Line Up
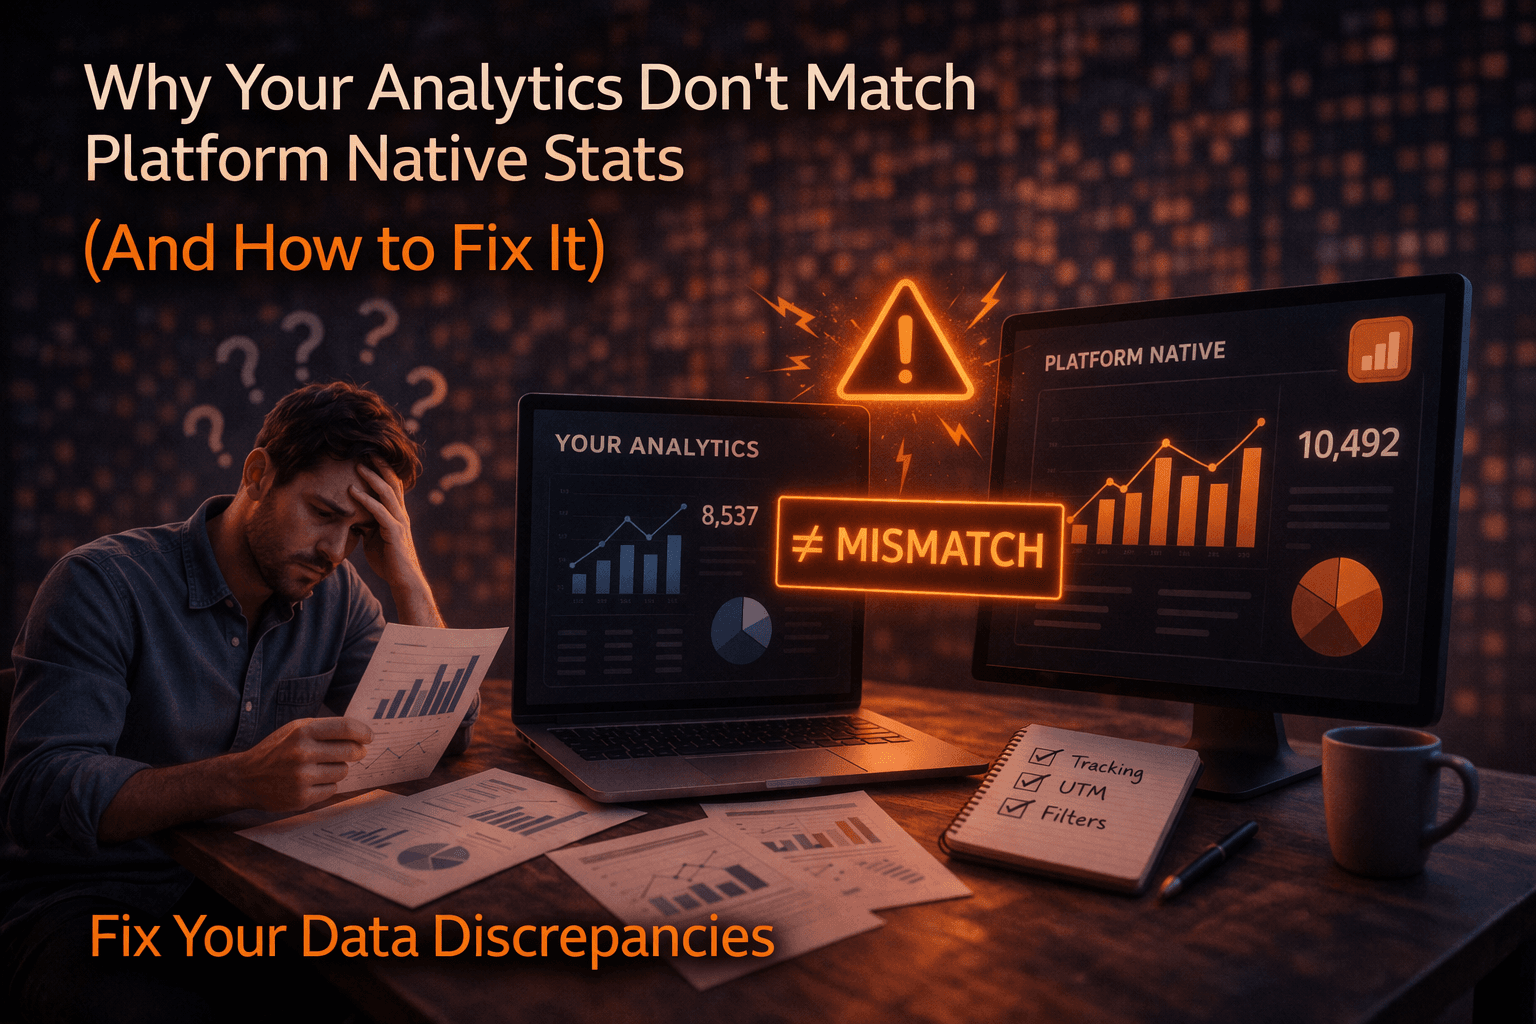
You open your analytics dashboard expecting clarity, but instead you get confusion. The numbers look close, but not quite right. Engagement is different, impressions don’t match, and sometimes even basic metrics like clicks or views are inconsistent across tools.
At first, you assume it is a delay, so you refresh, wait a few hours, and check again. The gap is still there. Then you start comparing platforms more closely, trying to figure out which number is actually correct, and before long, what should have been a simple reporting task turns into an investigation.
This is where trust starts to break. Not just your trust in the tools, but your client’s trust in the data you present. When numbers don’t align, it creates doubt, even if the performance itself is solid.
This problem is far more common than it seems, and it is not random. There are specific reasons why analytics rarely match perfectly, and once you understand them, you can fix the underlying issue instead of constantly second-guessing your data.
Why Your Analytics Don’t Match Platform Stats
The first thing to understand is that different systems measure different things, even when they use the same labels.
Platforms like social media networks track data internally based on how users interact within their environment, while third-party analytics tools often rely on external signals, APIs, or delayed data aggregation. This means the source of truth is already different before you even compare numbers.
Another major cause is timing differences. Platform-native stats are often updated in real time or near real time, while external tools may process data in intervals, which creates temporary mismatches that can persist longer than expected.
There is also the issue of data filtering. Platforms may exclude certain types of activity, such as bots or repeated actions, while external tools may include or interpret them differently, leading to discrepancies.
Attribution models add another layer of complexity. One system may attribute a conversion to the last click, while another distributes credit across multiple touchpoints, which changes how results are reported.
Finally, inconsistent execution environments can affect tracking. When actions are performed across different devices, sessions, or setups, data may not be captured uniformly, which introduces gaps.
The Hidden Cost of Mismatched Data
When analytics do not match, the impact goes beyond simple confusion.
Decision-making becomes harder because you are not sure which data to trust. This can lead to incorrect conclusions about performance, which affects strategy and resource allocation.
Client communication becomes more difficult as well. Explaining discrepancies repeatedly reduces confidence, even if the underlying performance is strong.
There is also a time cost. Instead of focusing on optimization, you spend time reconciling data, comparing reports, and trying to understand inconsistencies.
Over time, this creates friction in your workflow and reduces the effectiveness of your analytics as a decision-making tool.
The Real Problem: You’re Comparing Systems That Don’t Share a Source of Truth
The core issue is not that one system is wrong and the other is right, but that they are operating on different assumptions and data sources.
When multiple tools collect, process, and present data independently, discrepancies are inevitable. Even small differences in how data is captured or processed can lead to noticeable gaps.
What you need is not perfect alignment between systems, but a consistent and structured way to track and interpret data.
The Complete Solution: Standardize Execution and Tracking
The only way to reduce discrepancies is to control how data is generated and tracked from the start.
The first step is stabilizing your execution environment. Actions should be performed consistently so that data is captured in the same way across all interactions.
The second step is defining a primary source of truth. Instead of trying to reconcile every tool equally, you choose one system as the reference point and align your reporting around it.
The third step is structuring your workflows so that tracking becomes predictable. When execution follows a consistent pattern, data becomes more reliable.
This is where many teams encounter challenges, because maintaining consistent execution across multiple accounts, devices, and platforms is difficult without a controlled system.
This is also where tools like Appilot become relevant.
Instead of running actions across scattered environments, Appilot allows workflows to execute on real devices within a centralized system, which helps maintain consistency in how actions are performed and tracked. This reduces variability in data collection and makes analytics more reliable.
You could attempt to standardize this manually using multiple tools and configurations, but maintaining consistency at scale becomes complex. Appilot simplifies this by handling the execution layer, ensuring that data is generated under controlled conditions.
The key shift is moving from fragmented execution to standardized tracking.
Why Consistency Improves Data Accuracy
Once execution is consistent, discrepancies become easier to understand and manage.
Data collected from a controlled environment is more predictable, which reduces unexpected variation between systems.
Comparisons become clearer because you are working with data that follows the same structure.
Reporting becomes more reliable, allowing you to communicate results with confidence.
Most importantly, analytics return to their intended purpose, which is guiding decisions rather than creating confusion.
How to Prevent This From Becoming a Recurring Problem
Reducing discrepancies is not a one-time fix, it requires maintaining consistency over time.
You ensure that all workflows follow the same execution patterns, avoiding variations that introduce tracking differences.
You monitor data regularly to identify gaps early, rather than discovering them during reporting.
You refine your tracking setup as platforms evolve, ensuring that your system remains aligned with how data is collected.
Common Mistakes That Make This Worse
One of the most common mistakes is trying to force all tools to match perfectly, which is not realistic given how different systems operate.
Another mistake is relying on inconsistent execution environments, which introduces variability into data collection.
Some teams switch between tools without defining a clear source of truth, which increases confusion instead of reducing it.
The most critical mistake is assuming that discrepancies are unavoidable, when in reality they can be minimized with the right structure.
Conclusion: Data Mismatch Is a System Issue, Not a Tool Issue
If your analytics do not match platform-native stats, it is not because your tools are broken, it is because your system lacks consistency.
Once you standardize execution, define a source of truth, and structure your workflows, discrepancies become manageable and predictable.
You can continue trying to reconcile mismatched data manually, but as your operations grow, the complexity will grow with it.
At some point, you either build a system that ensures consistent tracking or use one that already does.
That is where platforms like Appilot fit in, not as a replacement for analytics tools, but as a way to create a consistent execution environment that makes your data more reliable and easier to trust.